In this study we try to predict the future prices of stocks using a Recurrent Neural Network (RNN) model and feeding it only with a time series of former closing prices. The expected result is a forecasted trend line for the next 20 days of trading, which is nearly equivalent to a calendar month.
Finding the most negotiated stocks at BM&FBovespa
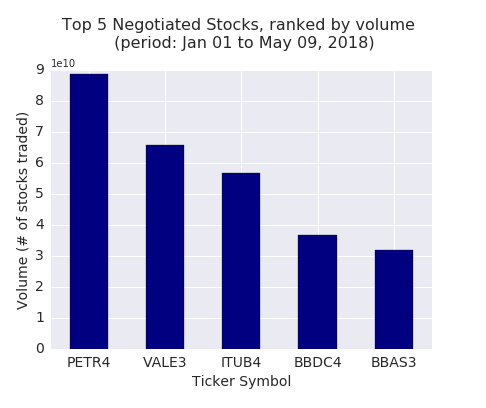
We begin the analysis collecting data of the stocks negotiated at the Brazilian stock exchange, BM&FBovespa (B3). We start identifying the 5 most negotiated stocks, using the cummulative total negotiated volumes in 2018, up to May 09.

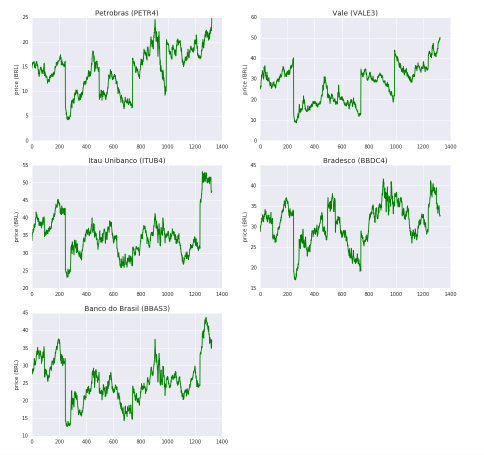
For the top 5 list, we retrieved the closing price for each trading day since the beginning of 2013, making a total of 1324 data price points for each stock. These time series were used to train the RNN model to predict future values.

Forecast: give past 60 closing prices and return next 20
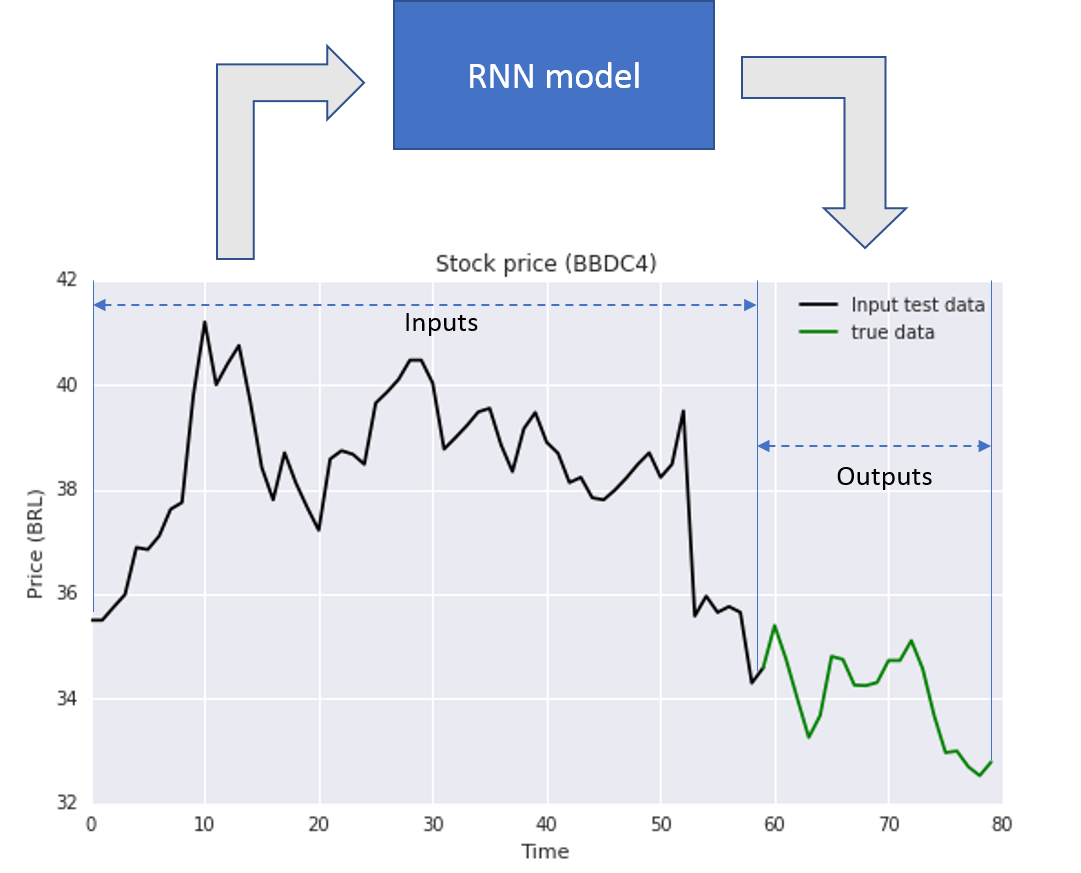
We created a RNN model into where we feed a time series and get as the output another time series of forecasted values. We chose to have 60 values of input, which is equivalte to approximately 3 months of working days of trading to predict 20 days in the future (nearly a month).

Error calculation and baseline estimators
The objective of the model is to produce a time series that is as close as possible to the true values. In order to check the precision we need to compare the model outputs against the true values, therefore we separated the last 20 points available in our dataset for that purpose. The series from Mar/04 up to May/09, where reserved for testing.
The metric we used to evaluate model precision was the Mean Absolute Percentage Error (MAPE), which is the average of the percentage errors, comparing each point the prediction to the true value. The MAPE is stated as a percentage and might be more intuitive than other error measures like Mean Square Error, for example. Below we show the MAPE formula.

When we create an estimator, it is also important to compare it to baseline estimators, which are much simpler models. This is specially important if we are using a complex model such as Recurrent Neural Networks; if a simple baseline estimator could provide an accuracy equal or better than our RNN, this means that we have to improve or tune the model.
Three baseline estimators where proposed:
- A naive, and also called persistent estimator, which takes the last point of the prediction series and keeps it along all the outputs
- A straight line made from the overall linear regression trend of the 60 inputs and extending it to the forecast
- A second straight line, but this time we would use only the last 20 points of the input series, making it of equal length as the output. This would mean that the more recent data points are more relevant to the forecast precision
In the chart below, we have the time series for test for Bradesco, where we plotted the 3 estimators and the resulting MAPE for each estimator. In this case, the naive estimator had the best result.

Model Predictions
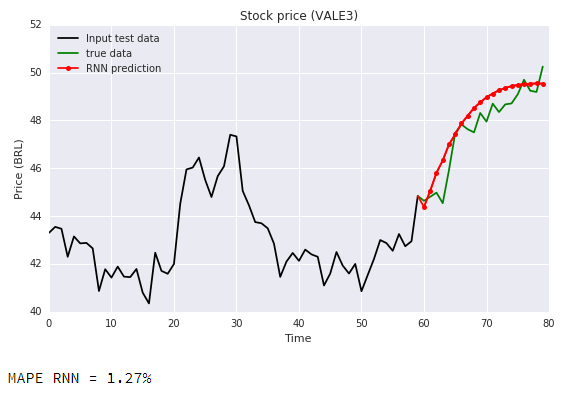
In the chart below the RNN model outputs are showed with a 1.43% MAPE, which beats all the baseline estimators.
Below we plotted the predictions of the other 4 stocks from our top most negotiated rank.

And finally, in the chart below we have the error comparison including the RNN model and the three baseline estimators:

We can see that the proposed RNN model is a good estimator, and it is impressive that it can predict the future price trend with reasonable accuracy only with the past information from former 5 years of trading (from 2013 up to now) .
In this model there is no consideration about macro-economic variables, nor any data related to their financial and operational perfomance. The inclusion of such information in the model as additional inputs could make the model perform even better.
References:
- Gustavo Bonesso – Brazilian Stock Quotes – Daily historical data at Kaggle – https://www.kaggle.com/gbonesso/b3-stock-quotes
- BM&F Bovespa – Historical data – http://www.b3.com.br/pt_br/market-data-e-indices/servicos-de-dados/market-data/historico/mercado-a-vista/series-historicas/
- Mean absolute percentage error – Wikipedia – https://en.wikipedia.org/wiki/Mean_absolute_percentage_error
- Tensorflow sequence-to-sequence model https://www.tensorflow.org/addons/tutorials/networks_seq2seq_nmt
- The Amazing Effectiveness of Sequence to Sequence Model for Time Series – Weimin Wang – https://weiminwang.blog/2017/09/29/multivariate-time-series-forecast-using-seq2seq-in-tensorflow/
