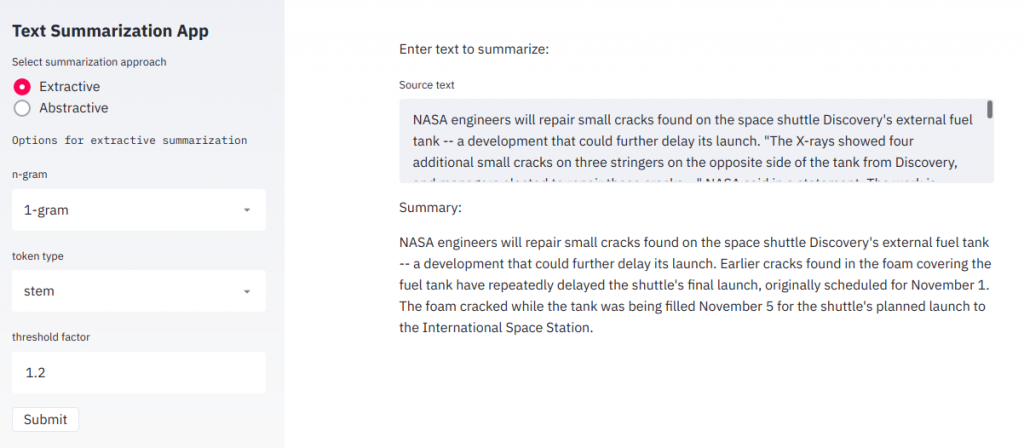
Go direct to the Summarizer App for demostration
Contents
- Project description
- Process raw data
- Exploratory data analysis (EDA)
- Sentence scoring algorithm
- Flask API on a web server
1. Project description
My Capstone Project on Springboard AI/ML Bootcamp was to develop a text summarization tool able to create a short version of a given document retaining it most important information. This task is relevant for to access textual information and produce digests of news, social media and reviews. It can also be applied as part of other AI tasks such as answering questions and providing recommendations.
We will perform the summarization task using two approaches: extractive and abstractive. In this first part of the project, we will develop the extractive approach, which means building a summary based on the selection of the most important and informative sentences from the source text. The other approach, abstractive, which is to generate a summary from the overall “understanding” of the the source text, is handled by a Recurrent Network model in the second part of the project.
The dataset is comprised of more than 92 thousand text documents with CNN stories followed by highlights, which will be used as the summary of each story. Therefore, our first task in data cleaning was to separate the stories from highlights and also carrying on some data cleaning in this process.
The CNN dataset was downloaded from New York University, in the version made available by Kyunghyun Cho, which can be found here.
2. Process raw data
I started taking the raw data, a 160 MB tar ball, and parsing the stories and their respective summaries in separated individual files. I also conducted some text processing tasks to clean some obvious non-desired features of the text corpus:
- For each story we remove the initial part of the text, which was a CNN office location plus the string ‘(CNN) — ‘ and also the double lines (i.e extra new line characters)
- For the summaries, we found the highlights using their headers (@highlight) and cleaned extra spaces and new line characters. We joined the highlighs to assemble a short summary
3. Explanatory Data Analysis (EDA)
The CNN dataset was loaded into a Pandas dataframe. The number of characters, words and sentences for each article and summary was counted and the distribution of these variables were analysed.
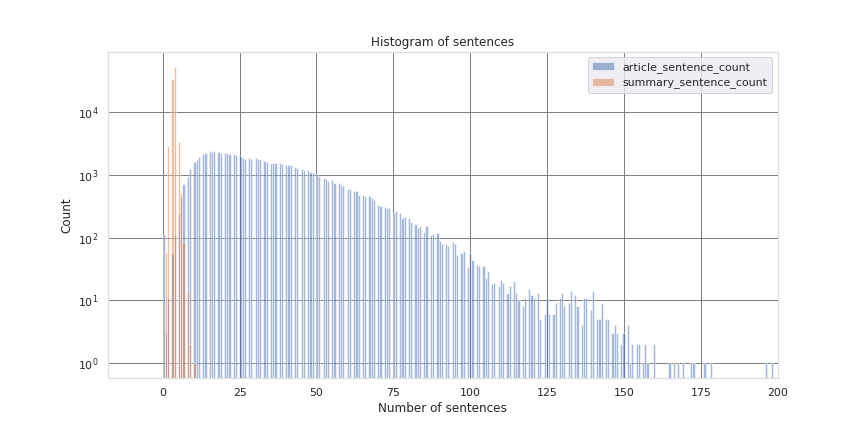
Below an example of analysis of the distribution of number of sentences in articles and summaries. One can see that summaries have typically less than ten sentences, while articles might have more than 100.
The analysis was also useful to identify issues in short articles, with only 0 to 2 sentences:
- zero-sentence articles are empty, although they might have an associated summary in the dataset corpus.
- one or two-sentence articles are in general malformed, referring to another document or video that is not in the corpus. We found again the long list type of article, with list of nominees of awards.
- all the other article analysed with number of sentences >= 3 seem legit. But we also spotted bogus text components that could be cleaned from the corpus, such as: ‘(EW.com)’, ‘CLICK HERE’, ‘(CNN)’, ‘NEW:’.
EDA was used to further clean the dataset, eliminating 708 malformed articles that represented only 0.76% of the original CNN dataset. I also analyzed the most frequent tokens (words, stems and lemmas) and part of speech (POS) tags. After cleaned, the dataset had the following statistics:

4. Sentence scoring algorithm
The sentence scoring algorithm was mostly based on Alfrick Opidi’s article on Floydhub, named “A Gentle Introduction to Text Summarization in Machine Learning”.
The algorithm is a extractive based summarizer that attributes a score to each sentence in the article based on the frequency of occurrence of their words. Words that repeat the most on the whole article contribute make the sentence get a higher score.
After scoring all sentences, the summary will be built only with the sentences with scores greater than a threshold. The threshold is the overall average of sentence scores in the article multiplied by a factor. The higher the factor, the more selective the summarizer is.
The algorithm inner functions are depicted in the chart below:
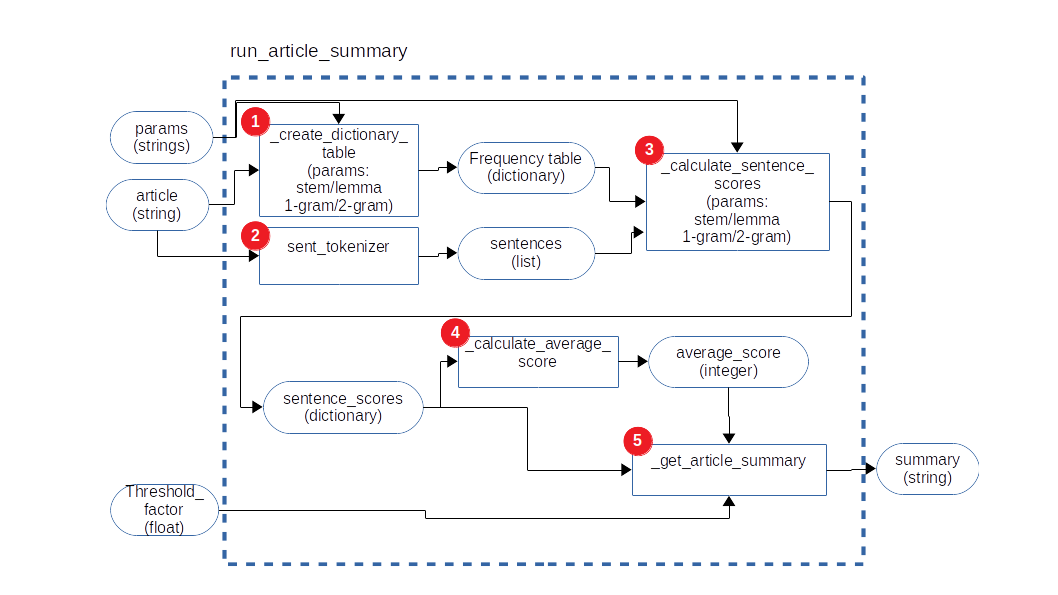
The run_article_summary function gets three main inputs:
- the article to summarize
- the parameters for counting words in sentences, which can be based on stems or lemmar, and the range of n-grams, which can be 1-gram (unique words) or 2-grams (pairs of sequencial words), 3-grams, etc
- threshold factor: a float number >= 1 to weight each sentence score against the average score of sentences.
The main function components are:
- _create_dictionary_table: create a frequency_table, counting the total n-grams in the article, based on stems or lemmas
- sent_tokenizer: function from nltk library to tokenize sentences in a string, giving back a list of strings, each string a sentence
- _calculate_sentence_scores: based on the sentences lists and the frequency table, will score each sentence based on the frequency apperance of each sentence n-gram in the whole article. Returns a dictionary with the score for each sentence
- _calculate_average_score: find the average of sentences scores in the article. This will form a basic threshold to select to extract sentences from the article to form the summary
- _get_article_summary: Extract from the article only the sentences that have scores that are equal or greater than a threshold, which is the average score of sentences multiplied by a factor
Below we included and example of an article:
NASA engineers will repair small cracks found on the space shuttle Discovery’s external fuel tank — a development that could further delay its launch. “The X-rays showed four additional small cracks on three stringers on the opposite side of the tank from Discovery, and managers elected to repair those cracks …” NASA said in a statement. The work is expected to take two to three days. Additional repairs may be needed, NASA said. The cracks on support beams called “stringers” showed up during the latest round of image scans that NASA has been conducting to determine when the shuttle can take off, the space agency said Thursday. The earliest possible launch date is February 3, according to the agency. Earlier cracks found in the foam covering the fuel tank have repeatedly delayed the shuttle’s final launch, originally scheduled for November 1. Technicians repaired the cracks and reapplied foam insulation on aluminum brackets on the tank in November. The foam cracked while the tank was being filled November 5 for the shuttle’s planned launch to the International Space Station. Discovery is scheduled to deliver a storage module, a science rig and spare parts to the orbiting facility. The delay means the final launch of Endeavour, which is also scheduled to be the last launch of the space shuttle program, is likely to be delayed until April 1, said Bill Gerstenmaier, associate administrator for space operations.
And the summary produced by the algorithm:
NASA engineers will repair small cracks found on the space shuttle Discovery’s external fuel tank — a development that could further delay its launch. Earlier cracks found in the foam covering the fuel tank have repeatedly delayed the shuttle’s final launch, originally scheduled for November 1. The foam cracked while the tank was being filled November 5 for the shuttle’s planned launch to the International Space Station.
Measuring the algorithm summaries quality using the ROUGE metric
ROUGE, or Recall-Oriented Understudy for Gisting Evaluation, is a set of metrics a for evaluating summarization. It takes two summaries, one produced by a machine and other by a human and compares the number of overlapping words found on both summaries.
- Hypothesis summary: the summary produced by the machine learning algorithm
- Reference summary: the summary produced by human, considered the golden standard
The main ROUGE metrics are:
- Recall: [latex] R = \frac{number \, of \, overlapping \, words}{total \, words \, in \, reference \, summary}[/latex]
- Precision: [latex]P = \frac{number\, of \, overlapping \, words}{total \, words\, in \, hypothesis \, summary}[/latex]
- F1 score: [latex]F1 = \frac{P*R}{ (1 – \alpha)*P\, +\, \alpha*R}[/latex]
After a test with 1,000 sampled articles, we concluded that a low threshold factor, near 1.0, produces low scores, but if we increase the factor the proportion of zero summaries (summaries where no sentences were selected) increases, reducing the overall mean. We found that the model parameters that maximize ROUGE F1 would be a threshold factor of 1.2, using unigrams and stems as tokens.

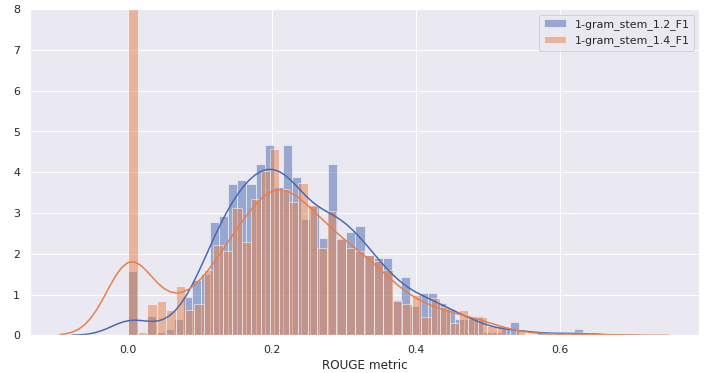
Our model is producing summaries which ROUGE F1 score at 23.7, which is a reasonable score compared with academic benchmarks of much more sophisticated summarization models using recurrent neural networks.

5. Flask API on a web server
The code that was firstly created on Jupyter notebook, was migrated to a Python script and encapsulated on a Flask API. Moreover, I created an app on Heroku platform and anyone can access the summarizer through http calls or the a friendly web interface.
HTTP POST calls to the API
Format of API call:
curl --data-binary @<filename> -d 'tokenizer=<stem | lemma>&n_gram=<1-gram |2-gram | 3-gram>&threshold_factor=<float number>' https://summarizer-lopasso.herokuapp.com/predict
The response is a JSON in the following format:
{"prediction" : "The generated summary"}
Web interface
You can access the app on GCP virtual instance using this link.
The app has a self explanatory page, where one inputs the text to be summarized and the algorithm parameters. When the button “Submit” is pressed, the generated summary appears in the field on the bottom of the page.
