In order to predict the stock prices we firstly collected a large amount of historical data which is avalaible at BM&FBovespa web site. The historical data of all negotiated assets are available for download, with daily information about price levels at openning, closing, minimum and maximum quotations, volume traded among others. We prepared a predictive analysis of the top 5 most negotiated stocks at BM&FBovespa that can be found here.
Data historical and recent data
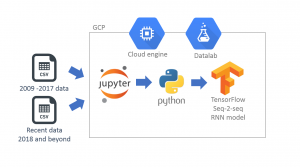
To accelerate data collection, we also used the file consolidated and shared by Gustavo Bonesso with data from 2009 up to 2018. Then we only complemented with more recent information, taking it directly from BM&FBovespa web site.
The data was then loaded to a Jupyter Notebook running Python 3, where we gathered and processed the data using Pandas dataframes. The predictions were made by RNN model, that was built and trained using Tensorflow. The Jupyter Notebook and Tensorflow were running on Datalab service at Google Cloud Platform (GCP). This made possible to use more powerful cloud virtual machines with two or more processors and GPUs (Graphical Processing Units), which are important to handle the processing intensive workloads of training neural networks.
RNN sequence-to-sequence model
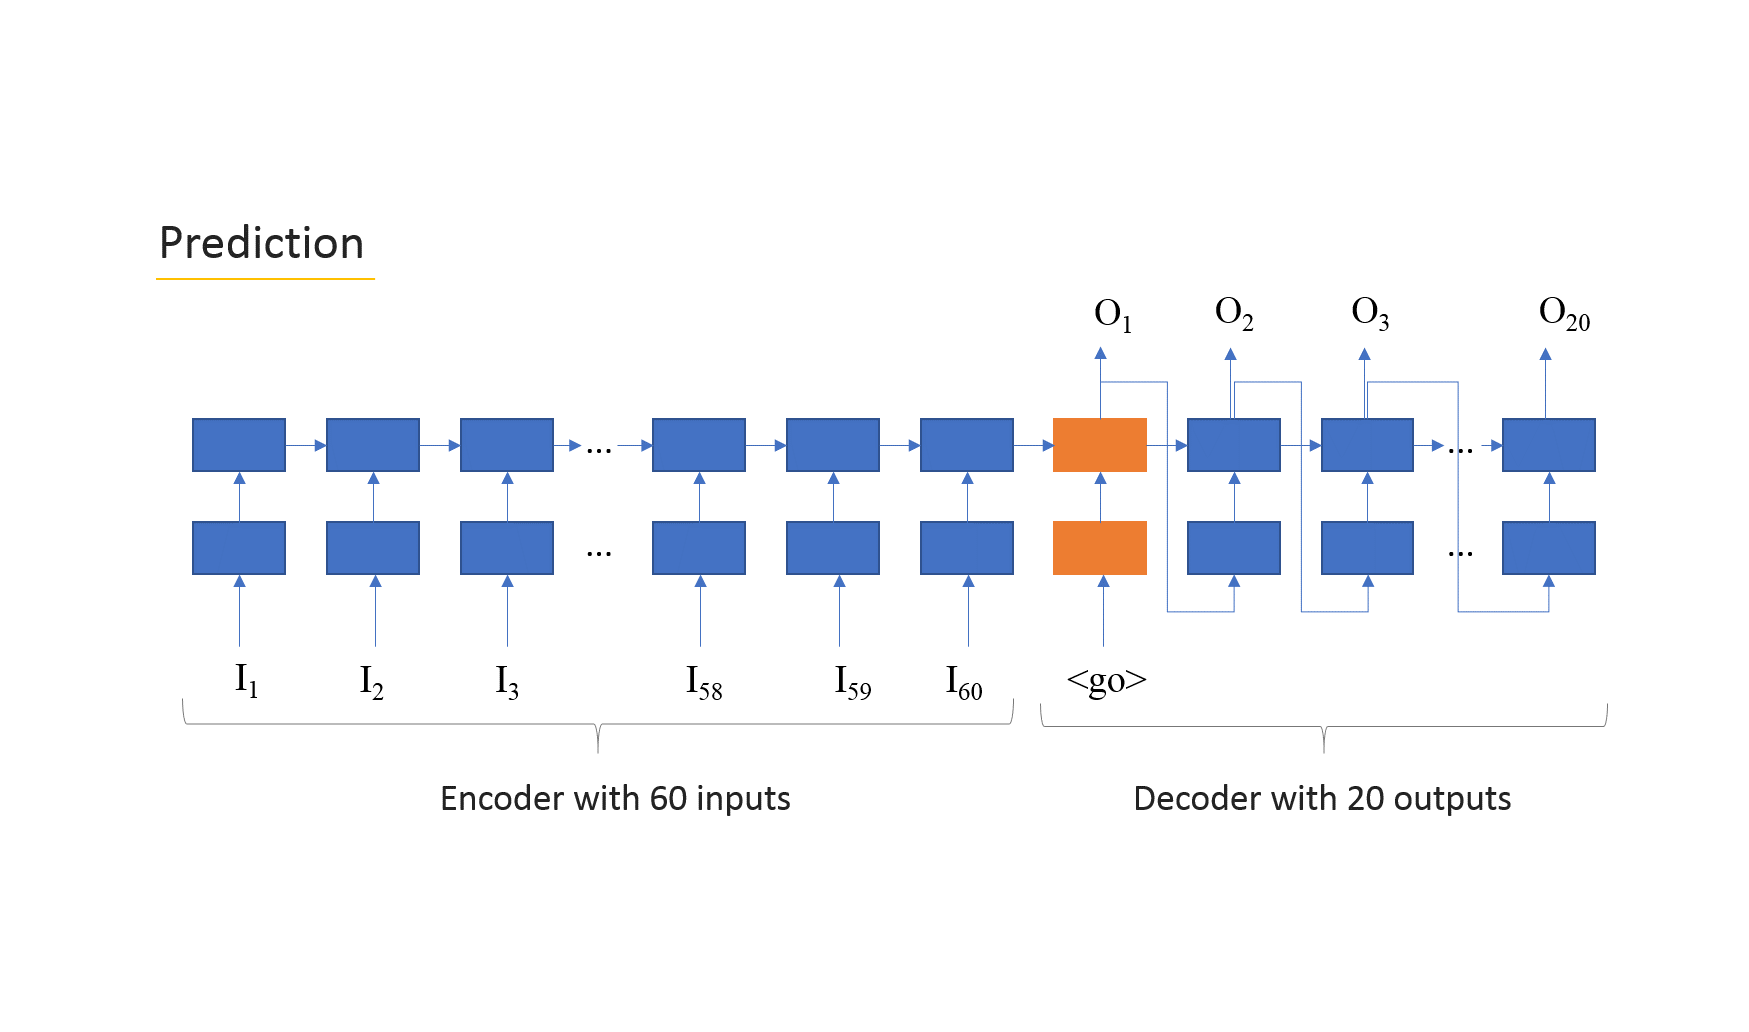
The model that we used was proposed by Weimin Wang as a slight variation of the official Tensorflow seq2seq model. This model is comprised of two parts: an encoder which reads the inputs and a decoder which estimates the output. Both encoder and decoder are made of cells, one for each input and output. Each cells is formed by neurons that can be stacked on layers. In our case, we have two layers of cells, each one made of 64 neurons.
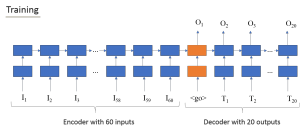
In the training phase we pass the true values to the decoder, in order to “guide” the RNN to produce the best estimates for the output. However, during the prediction phase or when we don’t have true values, the input that each cell gets is only the output of the previous cell of the decoder. The charts below shows the model during both training and prediction phases.
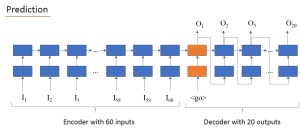
The “feed_previous” attribute of the function that creates the seq2seq model (the function is named “build_graph”) does the trick to setup the model for training or prediction.
Model hyperparameters
In our version of the seq2seq RNN model we used Gated Recurrent Units (GRU) with 64 neurons each, stacked in two layers. The number of dimensions of inputs and outputs is one, in the sense that we are only using a unique sequence for both input and output, but the “build_graph” function is prepared to build models able to receive more sequences in parallel. For example, we could add extra inputs, such as macro-economic indicators, financial data or even sentiment analysis score on news related to the company to make the predictions more accurate.
The lenght of input was 60, to match the 60 days of trading (nearly 3 months) and the lenght of output 20 days. Further details of the model and its code in Python can be found in the following Github.
Training of model versions for each stock
For ever stock we analyse we need to train specific parameters making a different version of the model. So we saved such values used by Tensorflow in a directory named with the ticker symbol of the stock we were training. We also included in the training function the possibility of initiating a brand new training file, or continuing training from an existing one. On average, we trained each version on 500 epochs and each epoch was comprised for each possible combination of data arranged into 1,284 segments. So, it is a lot of training that would benefit for great processing power, preferably boosted by a GPU.
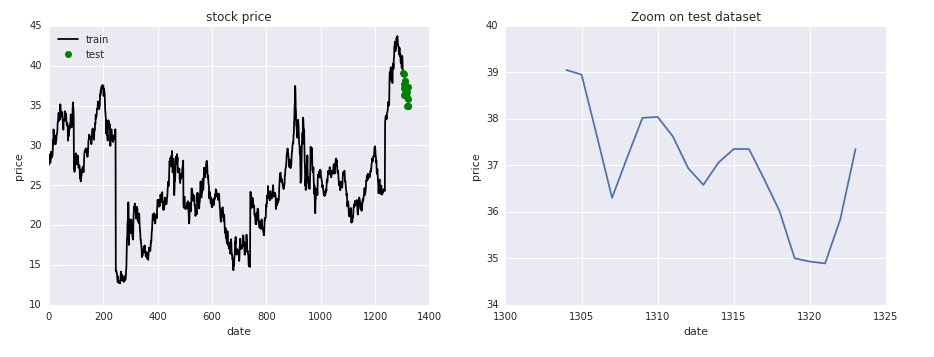
For each stock analyzed, we reserved the last 20 data points for testing, where we could make predictions without never feeding the true result in the model for training. So we could evaluate fairly how good the model performs with the most recent data available.
Evaluate results
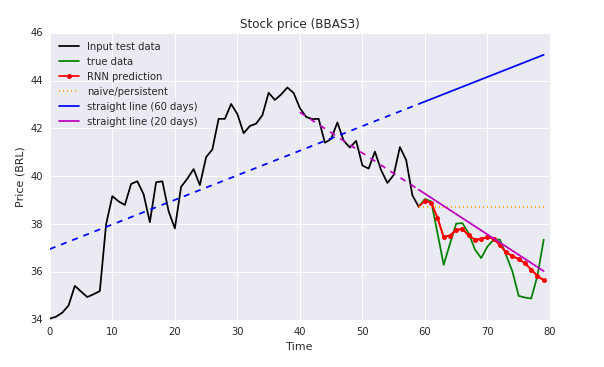
The results are evaluated using the mean absolute percentage error metric, and the RNN accuracy is compared to three baseline estimators. The error evaluation analysis and all the prediction results can be found here.
References:
- Gustavo Bonesso – Brazilian Stock Quotes – Daily historical data at Kaggle https://www.kaggle.com/gbonesso/b3-stock-quotes
- BM&F Bovespa – Historical data http://www.b3.com.br/en_us/market-data-and-indices/indices/broad-indices/indice-ibovespa-ibovespa-historic-statistics.htm
- Mean absolute percentage error – Wikipedia https://en.wikipedia.org/wiki/Mean_absolute_percentage_error
- Tensorflow sequence-to-sequence model – Github https://github.com/tensorflow/nmt
- The Amazing Effectiveness of Sequence to Sequence Model for Time Series – Weimin Wang https://weiminwang.blog/2017/09/29/multivariate-time-series-forecast-using-seq2seq-in-tensorflow/

